To solve issues quickly, organizations need to uncover the right insights for everyone from executives to the front lines — which requires smarter reporting.
You hear it everywhere: there’s more and more data out there for businesses to use, but how do you make sense of it? The common response — and we think it’s the right one — is that analytics can help you filter out the noise and get right to the actionable insights needed for any experience program, from employee and customer to digital, contact center, and market research. But this talk track often neglects the absolutely mission-critical middle part between analytics and action: reporting.
Let’s dive into the ways that personalized, easy, and collaborative analytics reporting can help organizations seamlessly improve experiences for everyone.
1. Reports should start with personalization
Personalized reporting ensures that your teams can actually understand and make use of the analytics that drive ROI by improving experiences, increasing satisfaction, and uncovering money and time-saving opportunities.
Each user and role needs accessible, visually appealing, curated reports. They should also be customized for mobile and desktop applications — on any device. For example, executives will likely not have time to look at a detailed desktop report, instead preferring a curated mobile report of their most vital KPIs. Frontline employees in retail might also prefer to use mobile devices, but for viewing in-the-moment customer feedback on the store floor.
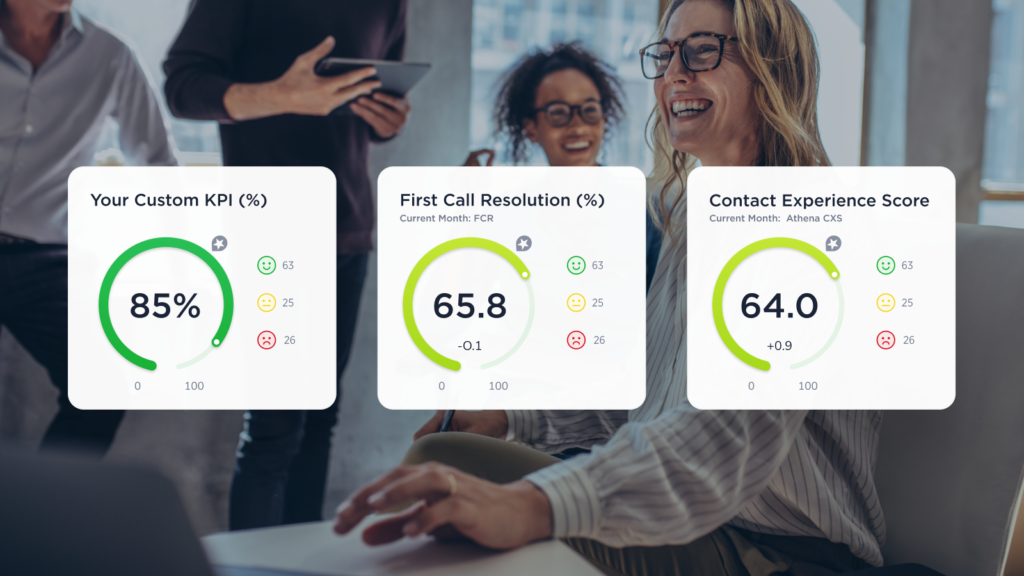
Medallia’s personalized reports show the most relevant KPIs, such as NPS, first contact resolution, cost of repeat contacts, OSAT, impact score, and sentiment, in an easily digestible way that inspires action. Further, text and speech analytics provide deeper context to these KPIs by helping all users understand what drives them up or down.
The partial employee performance report below is an example of how Medallia reports on both structured and unstructured data for a full view of employees.
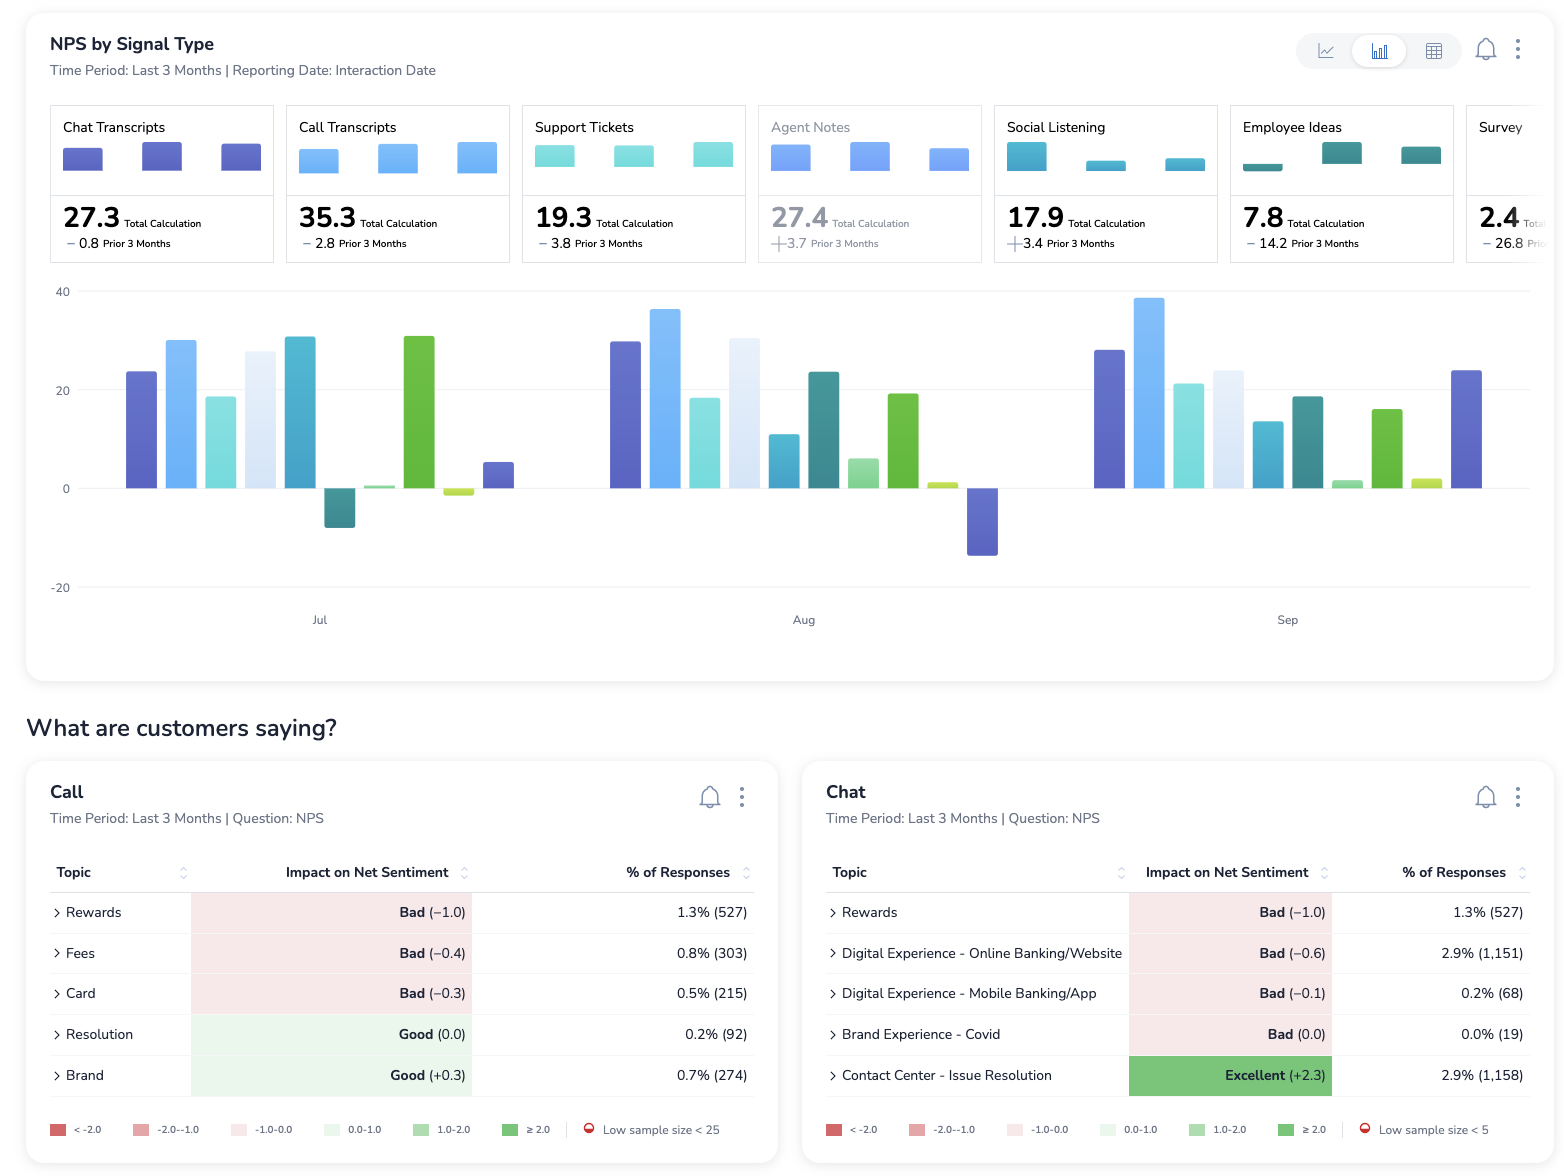
 Of course, reporting should extend beyond individual user needs to reflect the overall needs of the business. Per Forrester Research, one of the hardest questions companies need to ask themselves about their customer feedback platforms is, “What listening activities do we need to start, stop, or continue?” Excellent reporting throughout a platform should be able to give you insight into what is and is not driving value or producing actionable insights, including the sources for most of your data and KPIs associated with each signal.
Medallia’s Signal Health meets this need, giving experience teams insight into how KPIs differ across signals and which topics are driving those KPIs up or down, as seen below.
2. Reports should make it easy for everyone to take action
Think back to the most complicated software you’ve recently had to use. How long did it take for you to really be able to make use of all its features? It’s entirely possible you still haven’t because it’s too complicated. In the words of Nobel Prize winning behavioral economist Richard Thaler, “If you want people to do something, make it easy.”
If it is easy to uncover where teams need to take action and to communicate any problems, they can solve those problems faster.
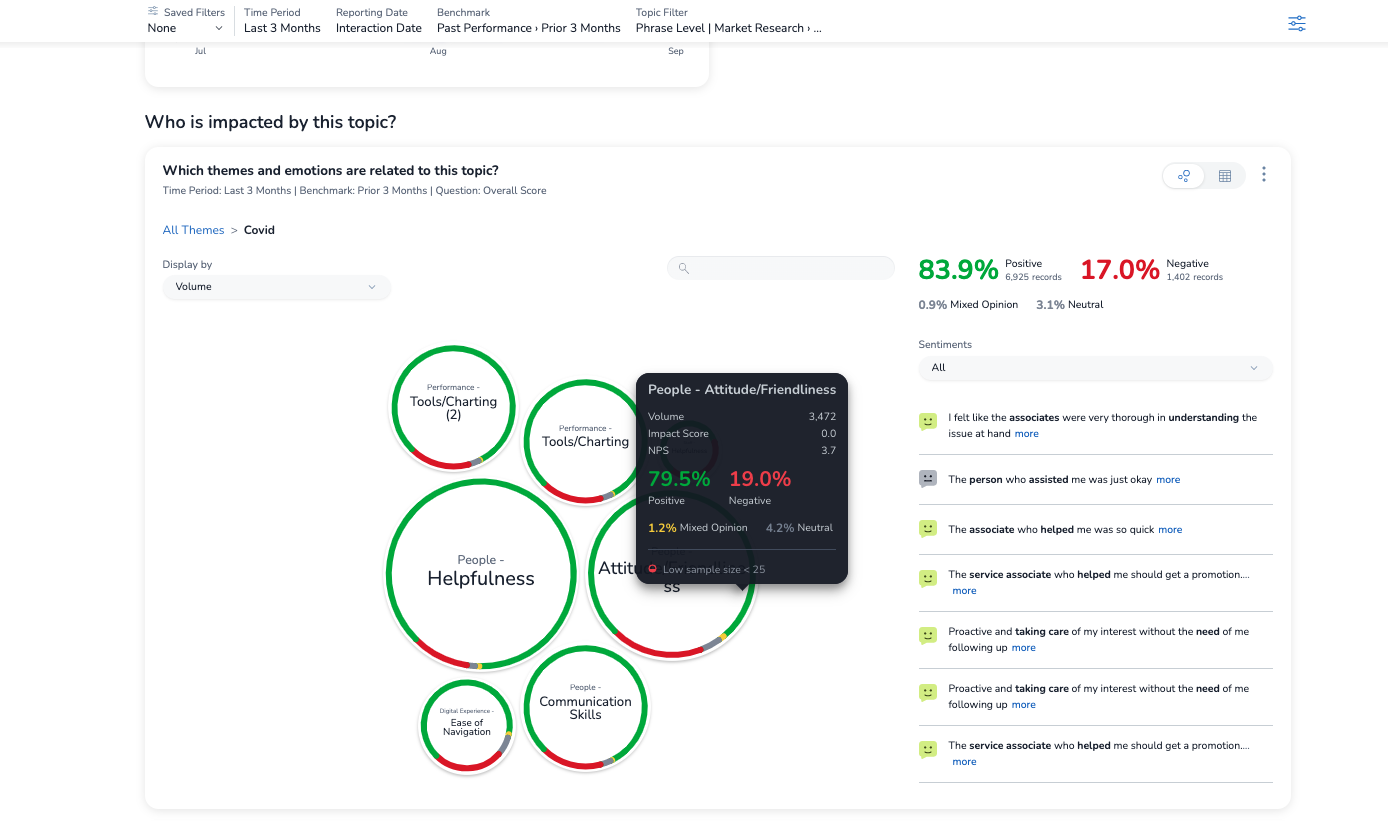
One way Medallia helps businesses uncover issues quickly in experiences is with Topic Deep Dive, which can be accessed by clicking on nearly any topic in a report. If you see that a given topic in an interaction is driving KPIs up or down — usually captured via the Medallia Impact Score — you can click into the topic to investigate the drivers of that topic.
For example, a hotel chain may notice that a topic’s Impact Score on NPS is going down. To figure out the reason, their analyst would use that topic’s Topic Deep Dive report to see which themes are associated with negative sentiment. Themes leverage unsupervised machine learning and text analytics to enable users to understand how data organically organizes, or clusters, together.
By drilling down into themes in a Topic Deep Dive, the analyst can narrow down what may be driving down NPS — going from insights to action in just a few clicks.
3. Reports should support collaboration across teams
Platform analytics must make it simple to disseminate insights and take action to overcome the insights-to-action gap. Which means reports should display specific recommendations for improvement for things like customer interactions, the impact of specific follow-up actions on NPS, and other insights that businesses can use to make smarter, data-driven decisions.
Collaborative reporting makes it easy for you to communicate with everyone from engineering to the C-suite via tagging, in-platform socialization capabilities, or simply exporting the content of reports for wider distribution.
For example, Medallia enables chat features in-platform to enable smoother communication and quick notification on new issues that need attention. Moreover, if Medallia’s Athena AI finds indicators of churn or risk, the proper supervisor or other user will be notified in their overview report when they log in.
The ability to comment on particular interactions or experiences and tag or alert another employee is incredibly useful for solving issues quickly. Similarly, being able to chat in-platform to address issues saves precious time for everyone involved. Simply put, reports and platforms should encourage collaboration. Collaborative reporting can be the difference between minimal and high ROI on a customer feedback platform.
The Best Analytics Reporting is Personalized, Easy, and Collaborative
The analytics reporting most relevant to your business may be different from everyone else’s, but they should follow these same principles.
At Medallia, we believe that experience analytics should work for everyone in a business, from the front line to the C-suite. We craft specific types of reports catering to every user in your organization — because democratizing experience analytics is not only a core value for us, but a key value driver for those using our platform.
For more information on how we handle reporting and analytics, check out our Discovery Demo: Harnessing Analytics for Smarter CX Decisions.